
In the first part of the series we got to know the forces that keep an airplane in the air. In the second part we move on to the airplane's performance: how fast, how far and how long can it fly? All of these questions depend on the same force: drag.
In the first step we defined drag as the air resisting the airplane's motion. In this step we will see that drag has two different sources, and that these two sources change in opposite directions with speed.
The drag equation
Drag is calculated with an equation very similar to the lift equation:
D = ½ · ρ · V² · S · Cᴅ
Here ρ is air density, V is speed, S is wing area and Cᴅ is the drag coefficient. As NASA explains, Cᴅ gathers all the complex effects of the airplane's shape and the flow conditions into a single number. Inside this coefficient there are two parts that behave very differently.
Parasite drag: the price of cutting through the air
Parasite drag is all the drag that has nothing to do with producing lift. The FAA's handbook divides it into three types:
- Form drag: Comes from the turbulence the air leaves behind as it flows around the fuselage, the landing gear or an antenna. The blunter the shape, the larger this drag.
- Interference drag: Arises where the wing joins the fuselage or the tail joins the fuselage, as the two flows mix.
- Skin friction: The friction of the air on the airplane's surface. A rough surface, exposed tape edges and dirt increase this drag.
The effect of shape is surprisingly large. According to NASA's wind tunnel values, the drag coefficient of a flat plate facing the flow is about 1.28, while that of a typical airfoil is about 0.045. For the same frontal area, a streamlined airfoil produces about 30 times less drag than a flat plate.
Because of the V² in the equation, parasite drag grows with the square of speed: double the speed and parasite drag quadruples.
Induced drag: the price of lift
The pressure under the wing is higher than the pressure above it. At the wingtip the air from below curls around towards the upper surface, where pressure is low, and leaves a rotating tube of air behind the wing: the wingtip vortex. The vortices push the air behind the wing downwards (downwash). This downwash tilts the airflow the wing "sees" slightly, so the force the wing produces also leans slightly backwards. The backward-pointing component of this force is called induced drag.
According to the equation given by NASA, the induced drag coefficient is:
Cᴅᵢ = Cʟ² / (π · e · AR)
AR is the wing's aspect ratio and e is the wing efficiency (1 for an elliptical lift distribution, less than 1 otherwise). The important point is this: induced drag grows with the square of the lift coefficient. In level flight lift must stay equal to weight; as the airplane slows down, it can only achieve this with a larger angle of attack, that is, a larger Cʟ. That is why induced drag increases as you slow down and decreases as you speed up.
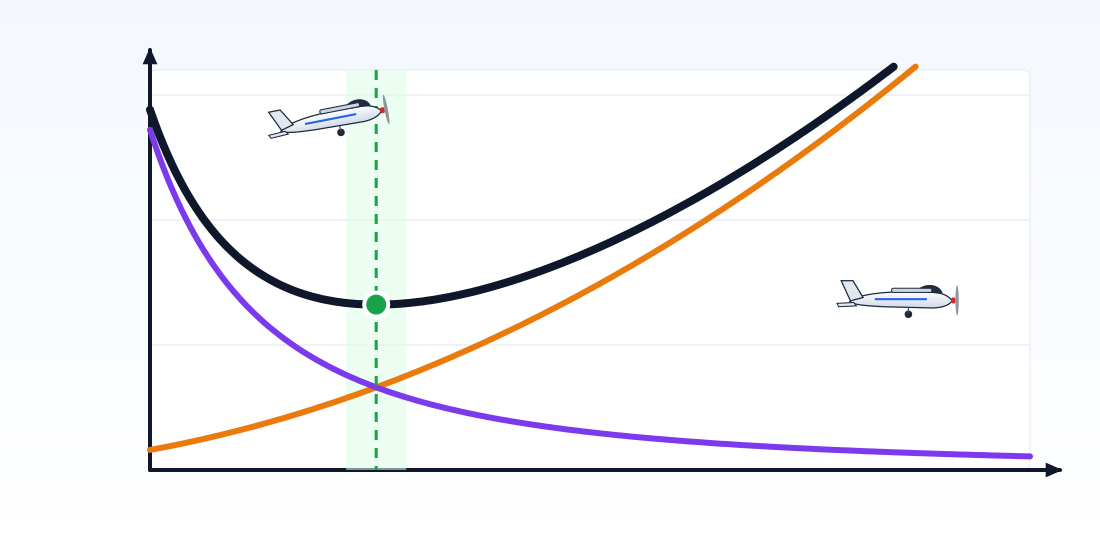 Parasite dragInduced dragTotal dragMinimum dragbest L/D · best glide speedSlow: large angle of attackFast: small angle of attackSpeedDrag
Total drag and the best L/D
When we add the two types of drag together we get a U-shaped curve. Induced drag dominates the left side of the curve and parasite drag the right side. At the speed where the total is lowest, the two types are equal.
Let us look at an example: a trainer model with a mass of 1.4 kg, a wing area of 30 dm² and an aspect ratio of 6 (Cᴅ₀ = 0.035, e = 0.8):
- At 8 m/s: parasite 0.41 N + induced 1.06 N = 1.47 N
- Around 10 m/s: parasite ≈ induced ≈ 0.66 N, total 1.32 N (lowest)
- At 12 m/s: parasite 0.93 N + induced 0.47 N = 1.40 N
- At 20 m/s: parasite 2.57 N + induced 0.17 N = 2.74 N
At the minimum drag speed, the ratio of lift to drag (L/D) reaches its highest value, about 10.4 in this example. According to the FAA's flying handbook, the best glide speed is also the speed at which the best L/D is achieved. We will come back to this speed later in the gliding step.
Practical takeaways for model flyers
- Reduce parasite drag: Route cables inside the fuselage, cover exposed tape edges, keep the landing gear and wheel areas tidy. These small jobs make the biggest difference at high speed.
- Keep your speed up on the landing approach: A very slow approach means falling onto the left side of the curve. In this region the airplane responds late to throttle and the stall margin shrinks.
- The right speed for long flights: On an electric model, the longest flight time is close to the minimum power speed, which is a little slower than the minimum drag speed. You can see this speed in the tool too.
Try it yourself
Change the flight speed and watch how the red dot moves along the curve. In the 3D view the orange arrow shows parasite drag and the purple arrows show induced drag. Notice how the wingtip vortices get stronger as you slow down.
JavaScript must be enabled in your browser for this interactive tool.
Next step
We saw that induced drag is related to the vortices at the wingtips. In the next step we look at the shape of the wing: why is a long, slender wing more efficient? What does tapering the wingtip change?
Sources
- NASA Glenn Research Center. What is Drag?
- NASA Glenn Research Center. Induced Drag Coefficient
- NASA Glenn Research Center. Shape Effects on Drag
- NASA Glenn Research Center. Lift to Drag Ratio
- Federal Aviation Administration (FAA). Pilot's Handbook of Aeronautical Knowledge (FAA-H-8083-25C). Chapter 5: Aerodynamics of Flight (parasite and induced drag); Chapter 11: Aircraft Performance (region of reversed command)
- Federal Aviation Administration (FAA). Airplane Flying Handbook (FAA-H-8083-3C). Best glide speed and L/D
This article was written by SVR AEROTECH as original work, drawing on the sources above; the figures belong to SVR AEROTECH. Quoted information belongs to the respective source owners.